Azure Windows Virtual Desktop - Monitoring the Spring Backend - WVD
The long await update from WVD/AVD is public. It comes with a full ARM integration and is natively useable in the Azure Portal. Some things changed from the Fall to Spring update, and that's include monitoring.
In this post, I'm focused on monitoring the WVD/AVD backend and not monitoring the sessions, applications, session host performance, latency, etc. To exactly monitoring these metrics, check out the solution "Azure Monitor for WVD" which works for Fall and the Spring update - and the new version comes with great Azure workbooks to additionally visualize data by host pool.
The Fall update writes logs to Azure Monitor / Log Analytics as custom logs. There is a really good blog post about this.
The Spring update writes logs to Log Analytics as well, but they have a different name and schema. To enable logging the backend, you have to enable the diagnostic settings on all involved resources:
- Workspace
- Host Pool
- App Group
Make sure that you select all logs and select your Log Analytics workspace (if you use sepago's "Azure Monitor for WVD" use the same Log Analytics workspace for the backend logging)
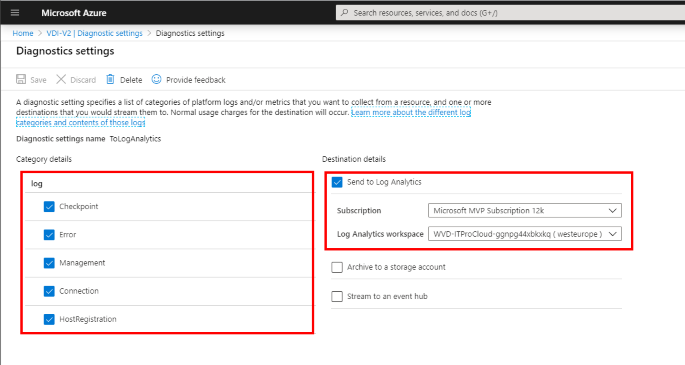
If you have done this for all resources, the WVD/AVD send logs to the selected workspace. Keep in mind that writing the first entries can take up to 20 minutes to build the data schema initially.
After a while, you should have log data in your Log Analytics workspace:
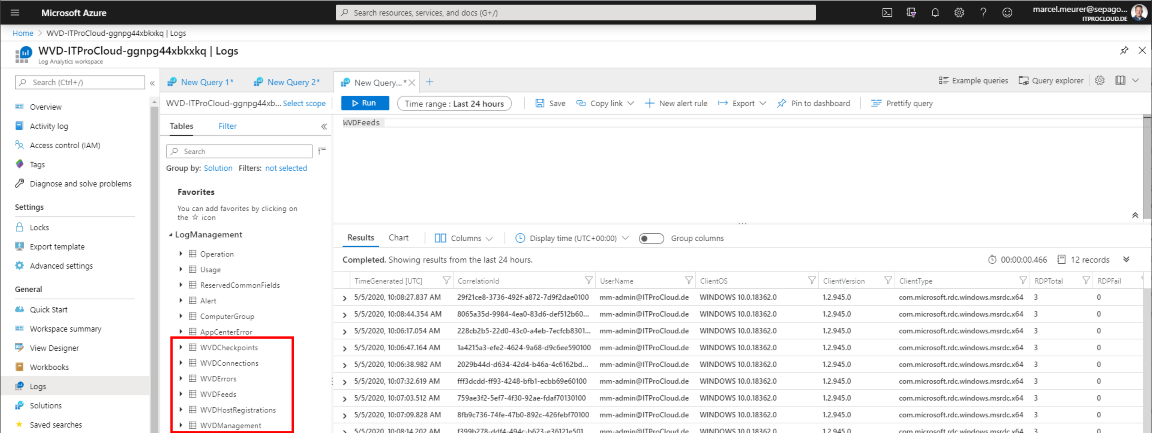
You can see the following logs (tables):
- WVDCheckpoints
- Intermediate steps while establishing and running a connection
- WVDConnections
- Start/End of connections
- WVDErrors
- Errors while establishing a connection, failures during the administration, failures getting feed informations
- WVDHostRegistrations
- About session host registration to host pools
- WVDManagement
- Administration log
The logs are internally connectable with their correlation id you have in each log.
Let's start digging some data
Open Log Analytics an go to "Logs" and run your queries based on the KUSTO query language.
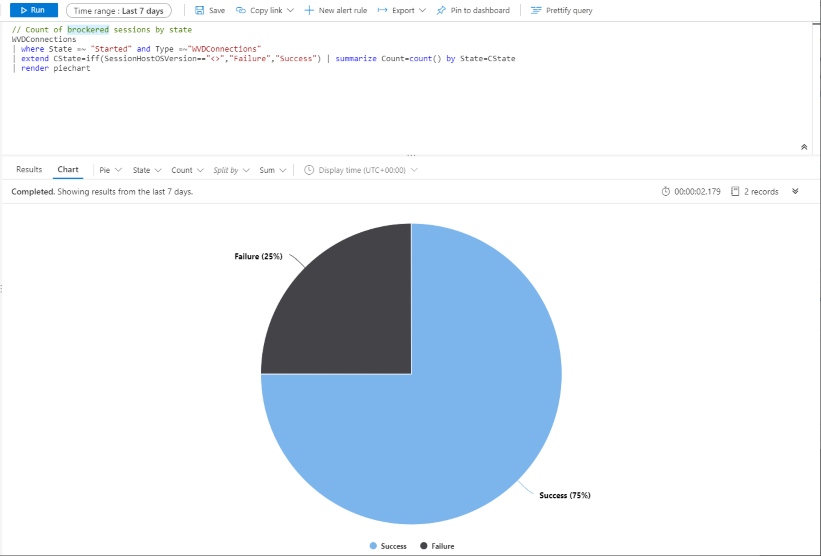
Count of brokered sessions by state
WVDConnections
| where State =~ "Started" and Type =~"WVDConnections"
| extend CState=iff(SessionHostOSVersion=="<>","Failure","Success") | summarize Count=count() by State=CState
| render piechart

Failed connections
WVDConnections
| where State =~ "Started" and Type =~"WVDConnections"
| extend Multi=split(_ResourceId, "/") | extend CState=iff(SessionHostOSVersion=="<>","Failure","Success")
| where CState=~"Failure"
| project TimeStamp=TimeGenerated, UserName, ResourceGroup=Multi[4], HostPool=Multi[8],ResourceAlias, SessionHost=SessionHostName, ClientOS=ClientOS, ClientWvdVersion=ClientVersion, CorrelationId
| order by TimeStamp desc
Failed connection with details
WVDConnections | where State =~ "Started" and Type =~"WVDConnections"
| extend Multi=split(_ResourceId, "/") | extend CState=iff(SessionHostOSVersion=="<>","Failure","Success")
| where CState =~"Failure"
| order by TimeGenerated desc
| where State =~ "Started" | extend Multi=split(_ResourceId, "/")
| project ResourceAlias, ResourceGroup=Multi[4], HostPool=Multi[8], SessionHostName ,UserName ,CState=iff(SessionHostOSVersion=="<>","Failure","Success"), CorrelationId, TimeGenerated
| join kind= leftouter (
    WVDErrors
) on CorrelationId
| extend DurationFromLogon=datetime_diff("Second",TimeGenerated1,TimeGenerated)
| project  TimeStamp=TimeGenerated, DurationFromLogon, UserName, ResourceAlias ,SessionHost=SessionHostName ,Source ,CodeSymbolic , ErrorMessage=Message, ErrorCode=Code, ErrorSource=Source ,ServiceError, CorrelationId
| order by TimeStamp desc
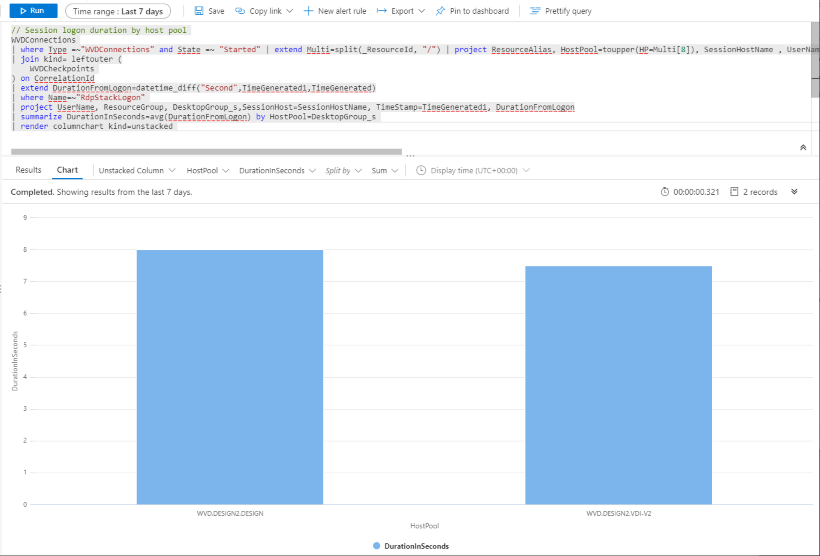
Session logon duration by host pool
WVDConnections
| where Type =~"WVDConnections" and State =~ "Started" | extend Multi=split(_ResourceId, "/") | project ResourceAlias, HostPool=toupper(HP=Multi[8]), SessionHostName , UserName ,CState=iff(SessionHostOSVersion=="<>","Failure","Success"), CorrelationId, TimeGenerated, ResourceGroup=Multi[4], DesktopGroup_s=toupper(strcat(RG=Multi[4],".", HP=Multi[8]))
| join kind= leftouter (
    WVDCheckpoints
) on CorrelationId
| extend DurationFromLogon=datetime_diff("Second",TimeGenerated1,TimeGenerated)
| where Name=~"RdpStackLogon"
| project UserName, ResourceGroup, DesktopGroup_s,SessionHost=SessionHostName, TimeStamp=TimeGenerated1, DurationFromLogon
| summarize DurationInSeconds=avg(DurationFromLogon) by HostPool=DesktopGroup_s
| render columnchart kind=unstacked
Session logon duration by user (desc)
WVDConnections
| where Type =~"WVDConnections" and State =~ "Started" | extend Multi=split(_ResourceId, "/") | project ResourceAlias, HostPool=toupper(HP=Multi[8]), SessionHostName , UserName ,CState=iff(SessionHostOSVersion=="<>","Failure","Success"), CorrelationId, TimeGenerated, ResourceGroup=Multi[4], DesktopGroup_s=toupper(strcat(RG=Multi[4],".", HP=Multi[8]))
| join kind= leftouter (
    WVDCheckpoints
) on CorrelationId
| extend DurationFromLogon=datetime_diff("Second",TimeGenerated1,TimeGenerated)
| where Name=~"RdpStackLogon"
| project UserName, ResourceGroup, DesktopGroup_s,SessionHost=SessionHostName, TimeStamp=TimeGenerated1, DurationFromLogon
| summarize DurationInSeconds=avg(DurationFromLogon) by HostPool=UserName
| order by DurationInSeconds desc
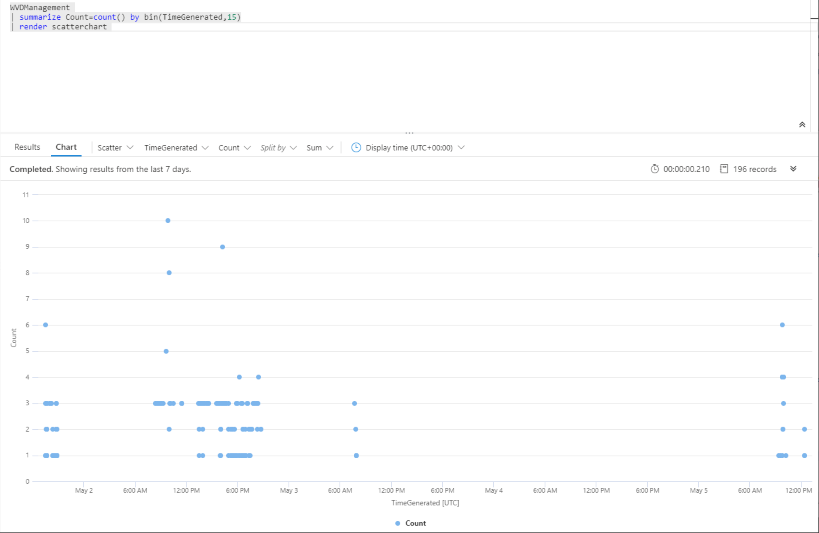
Administrative activities over time
WVDManagement
| summarize Count=count() by bin(TimeGenerated,15)
| render scatterchart
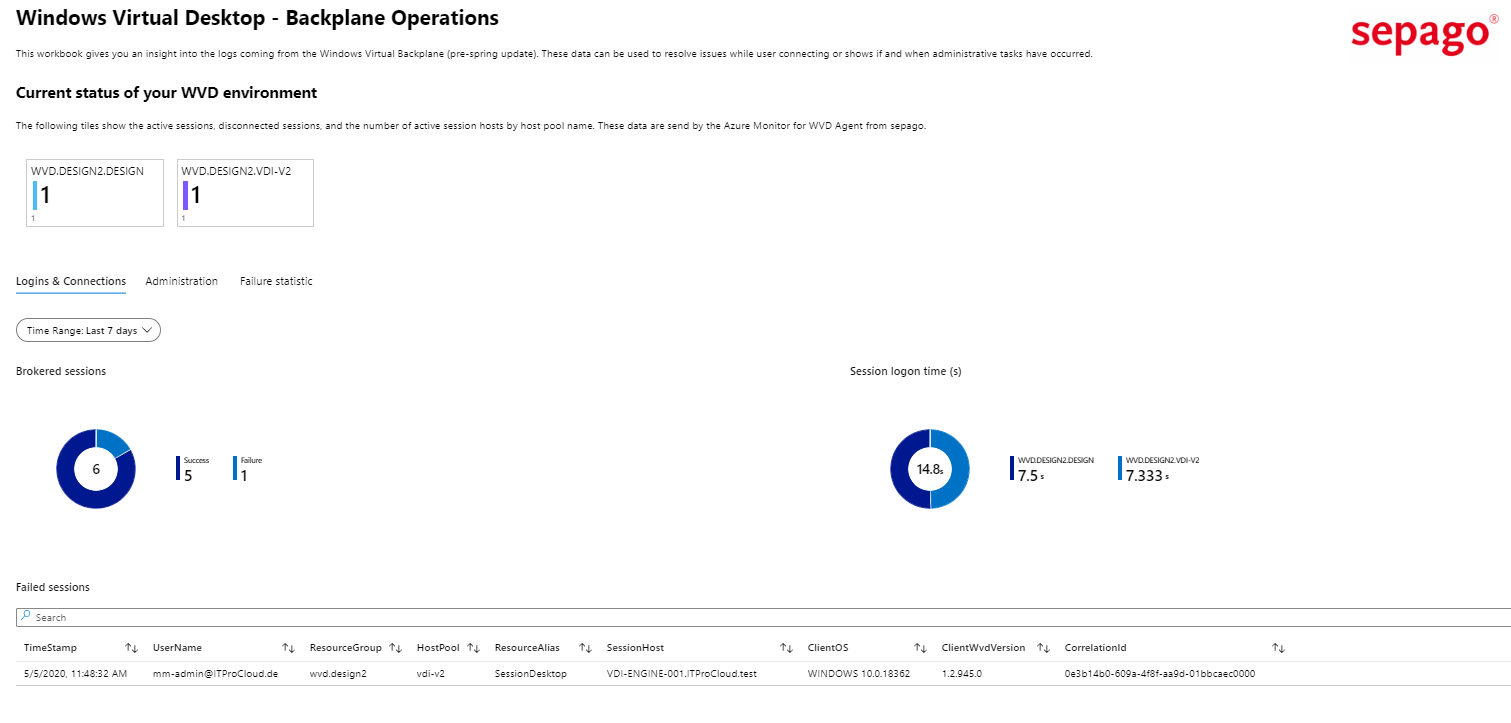
Good to know: Sepago's commercial "Azure Monitor for WVD" brings the ready to use Azure workbooks for the session and app monitoring and workbooks for the WVD/AVD backend:
