Push Azure AD User properties into Azure Monitor Log Analytics to build Azure Windows Virtual Desktop (WVD) performance data based on these
Azure Monitor / Log Analytics is my first choice to store log and usage data. Even for Azure Windows Virtual Desktop (WVD/AVD), it is crucial to have an eye on the hosts, users, and single applications' usage and performance.
I do that using Azure Monitor for WVD/AVD (https://www.sepago.de/en/azure-monitor-en/) from sepago, which is also included in Nerdio Manager for WVD/AVD (https://getnerdio.com/nerdio-manager-for-wvd/).
The solution gives you insight into the performance of the apps and hosts and allows you to build a cost calculation on a per-user base. If you want to query and analyze data by other properties - like the department - you have to include these properties from Azure AD into your log analytics workspace.
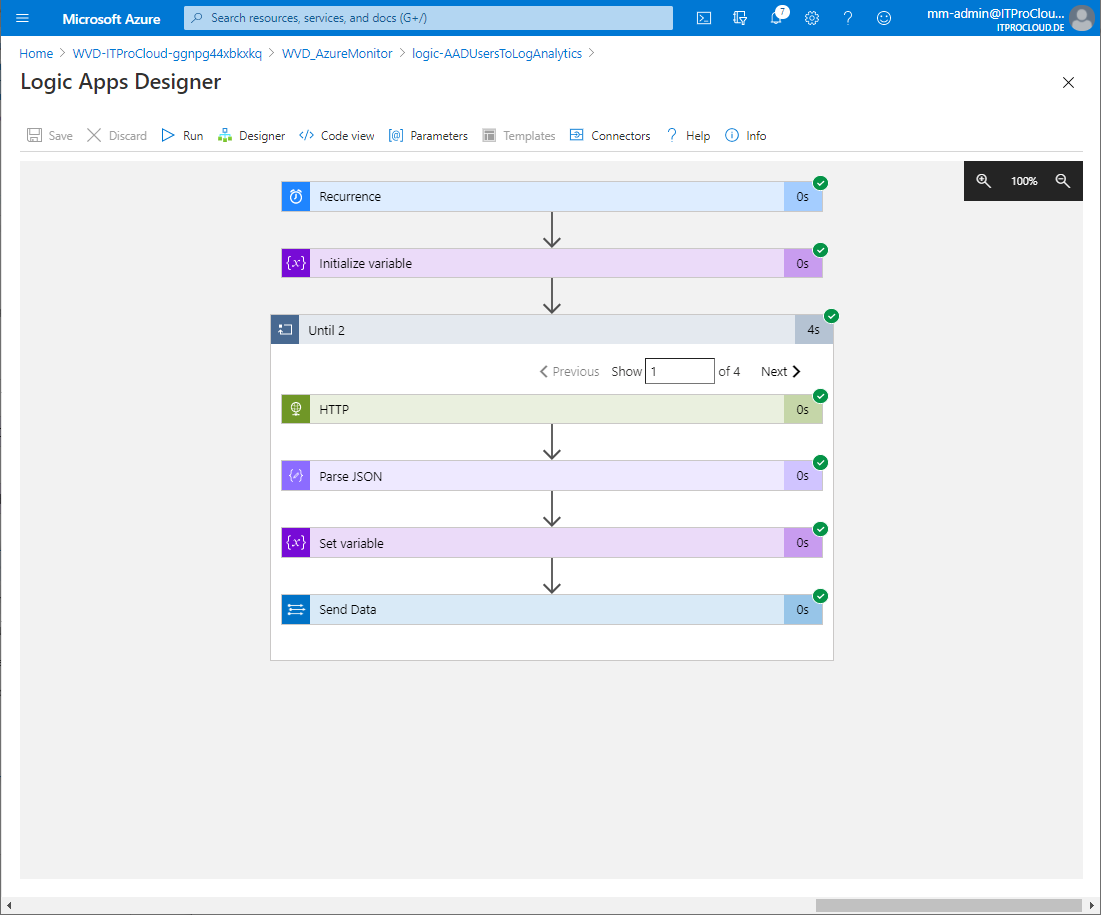
I found an easy solution doing that with an Azure logic app. The logic app access the Azure AD tenant and queries the users and some defined properties and send it to log analytics. A challenge was to handle the challenge that you have to query multiple times to get all users from Azure AD (a single query gives you only a specific amount of users -> Paging). I solved this using an "Until-loop" to get all users. The logic app pushed the users and their properties to the defined log analytics workspace. After this, the users and properties can be used in a KUSTO query. For example: To query the over-all session runtime by the department.
Installation and configuration
Deploy the prepared logic app into your subscription using the "Deploy to Azure" button.
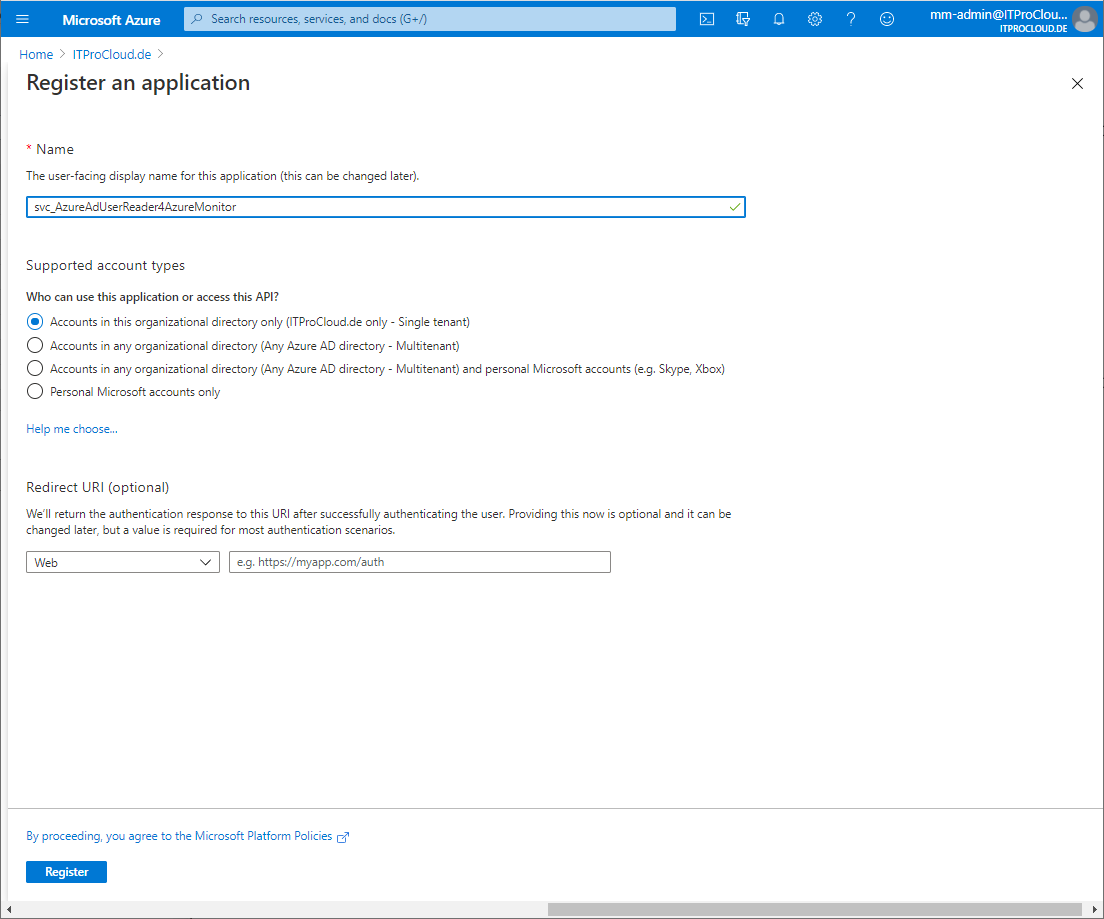
To query the Azure AD unattended, you need a service principal (a function account) with the right permission. Create the service principal in the Azure Portal:
- Azure Active Directory -> App registrations -> New registration and give it a name (e.g. svc_AzureAdUserReader4AzureMonitor) and press register
- Go to Certificates and secrets -> Add new client secret and type in a name (e.g. Key1) and expiration date (make a note into your calendar) and press add
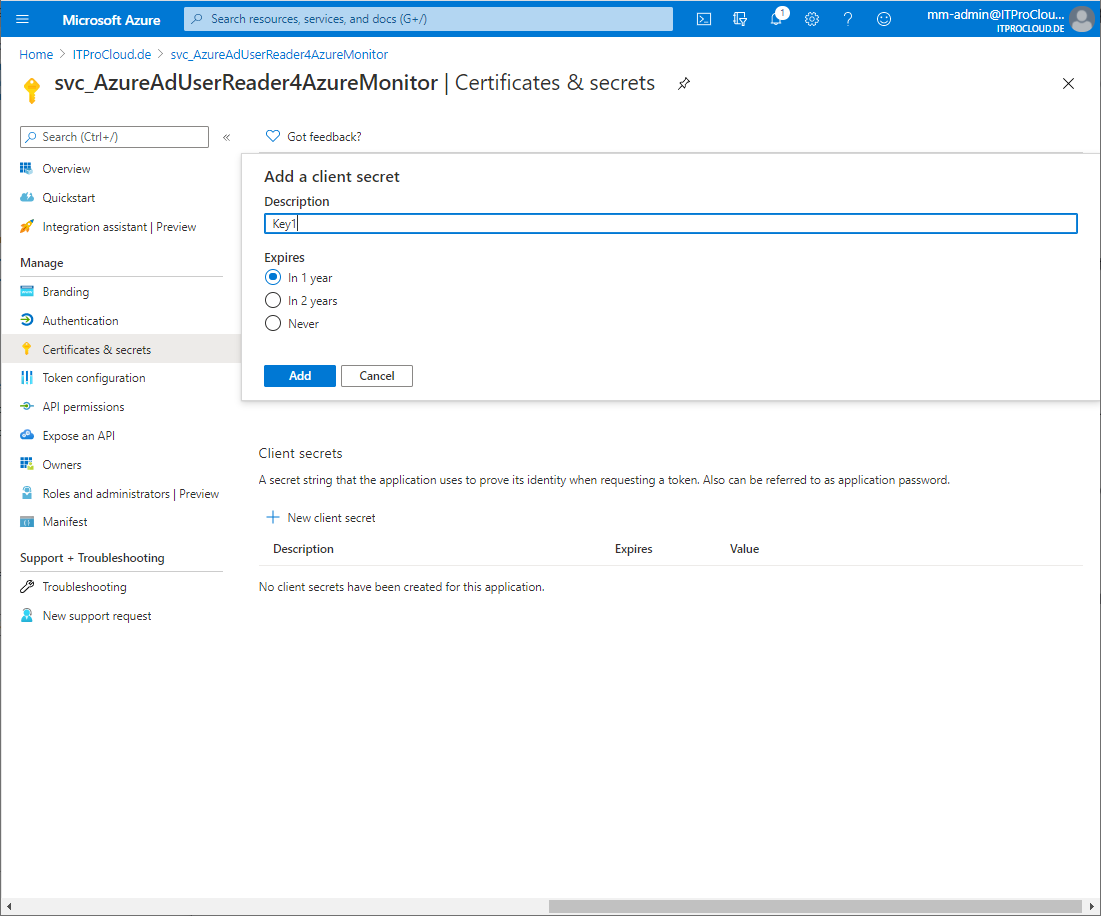
- Copy the generated secret for later use
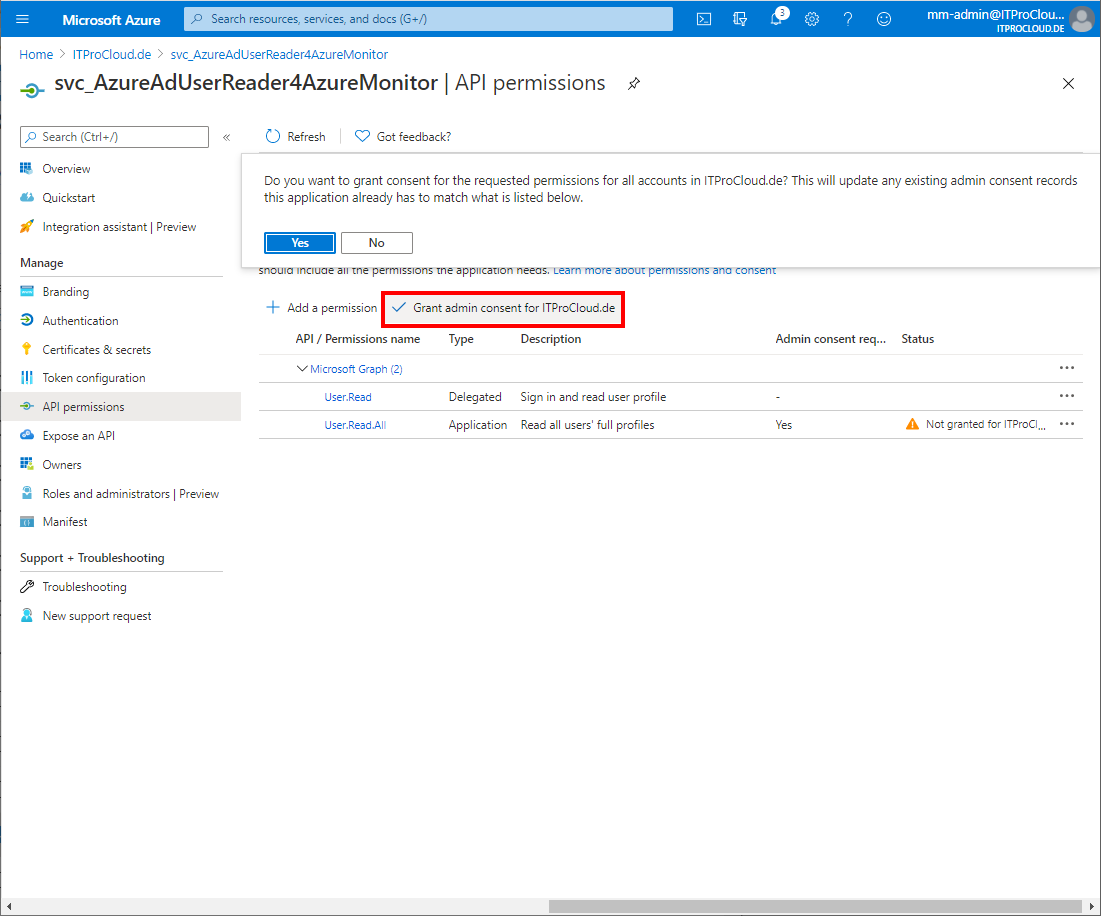
- Go to Api permissions -> Add a permission -> select Microsoft Graph -> Application permissions -> select User.Read.All -> click Add permissions
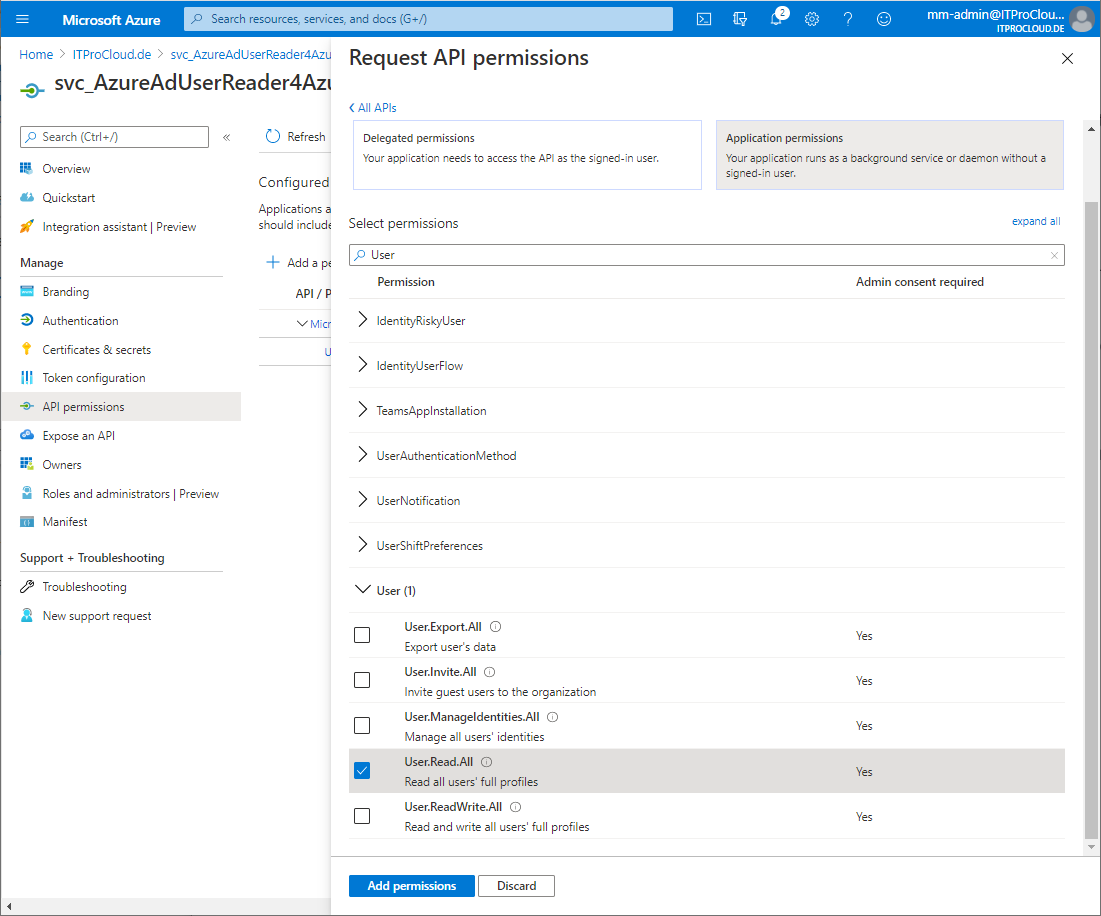
- Click Grant admin consent to allow this setting (you have to be in the right role to do that)
- Go to overview and copy the application id and directory id for later use
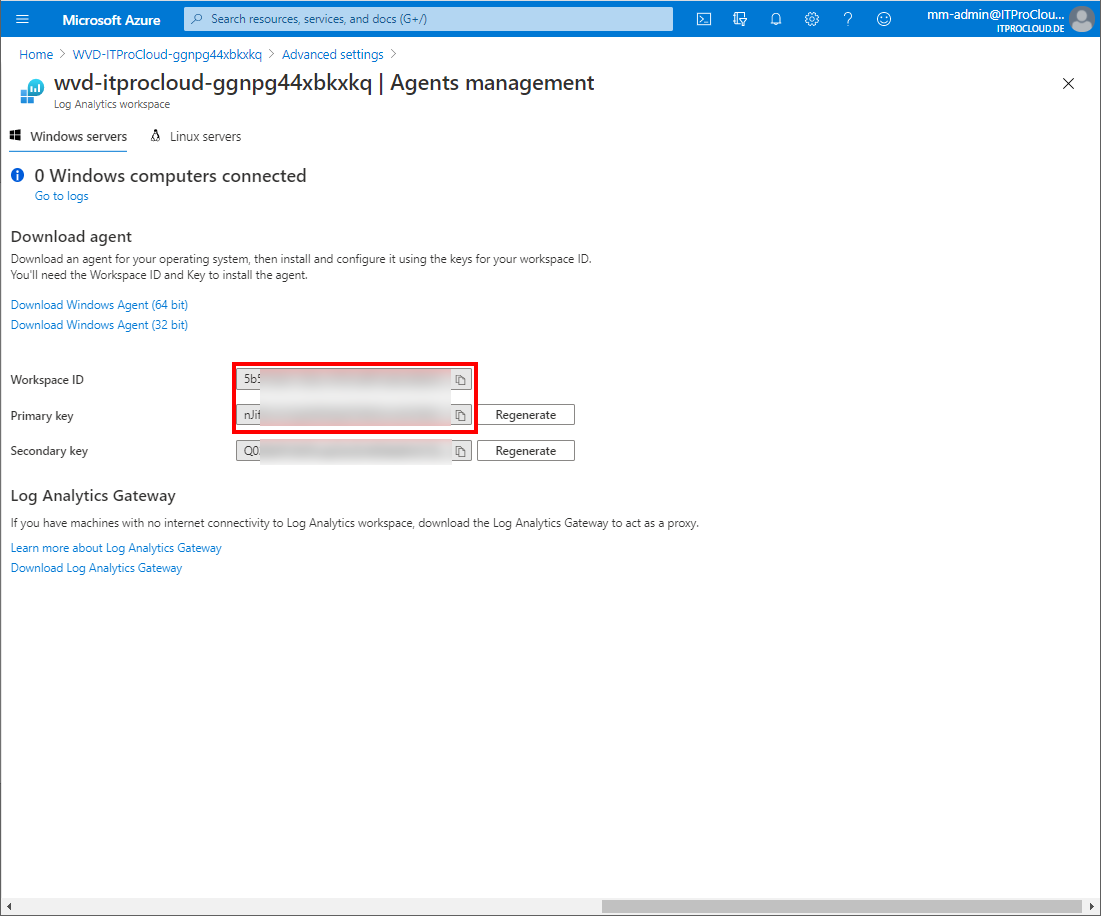
To upload the data to your Azure Monitor / log analytics workspace, you need the workspace id and key.
- Go to your log analytics workspace -> select Advanced settings -> Agents management -> copy the workspace id and primary key for later use
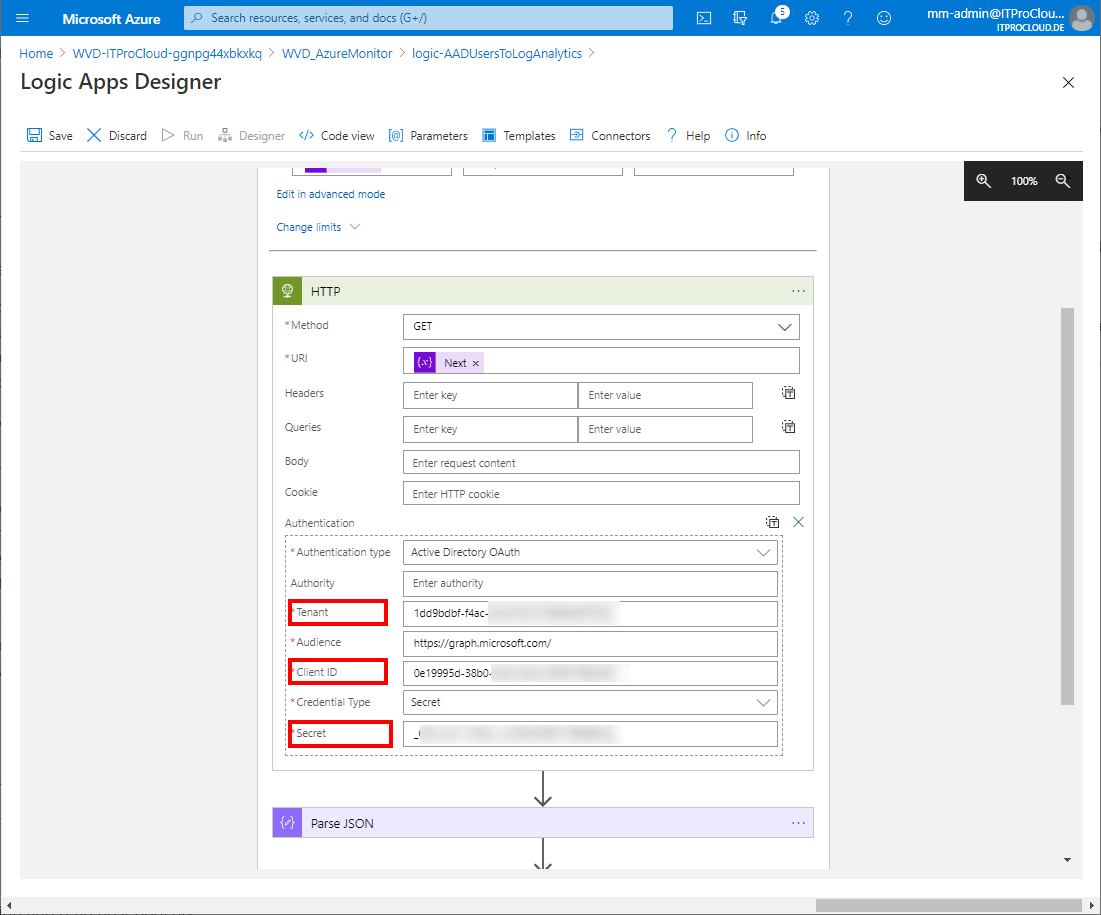
Go to your deployed logic app and click edit.
Expand "Until 2"
Click on http. Enter the data from your service principal into the fields Tenant (Directory id), client id, and secret
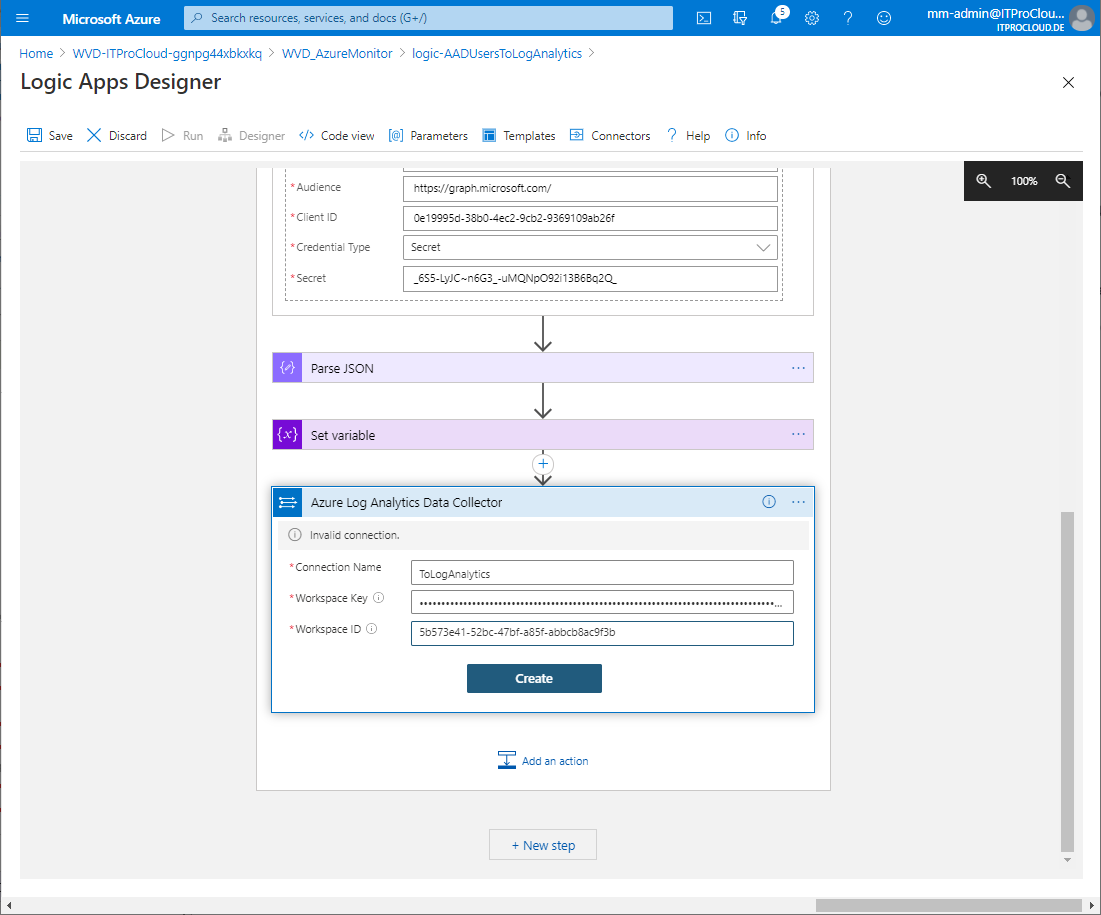
Click on Connections and add a new one (Add new)
- Give a name (e.g. ToLogAnalytics), the primary key and workspace id from log analytics and press create
- Give a name (e.g. ToLogAnalytics), the primary key and workspace id from log analytics and press create
Save the logic app and press run to test it.
If everything looks good, our logic app will write the user data to log analytics once a day.

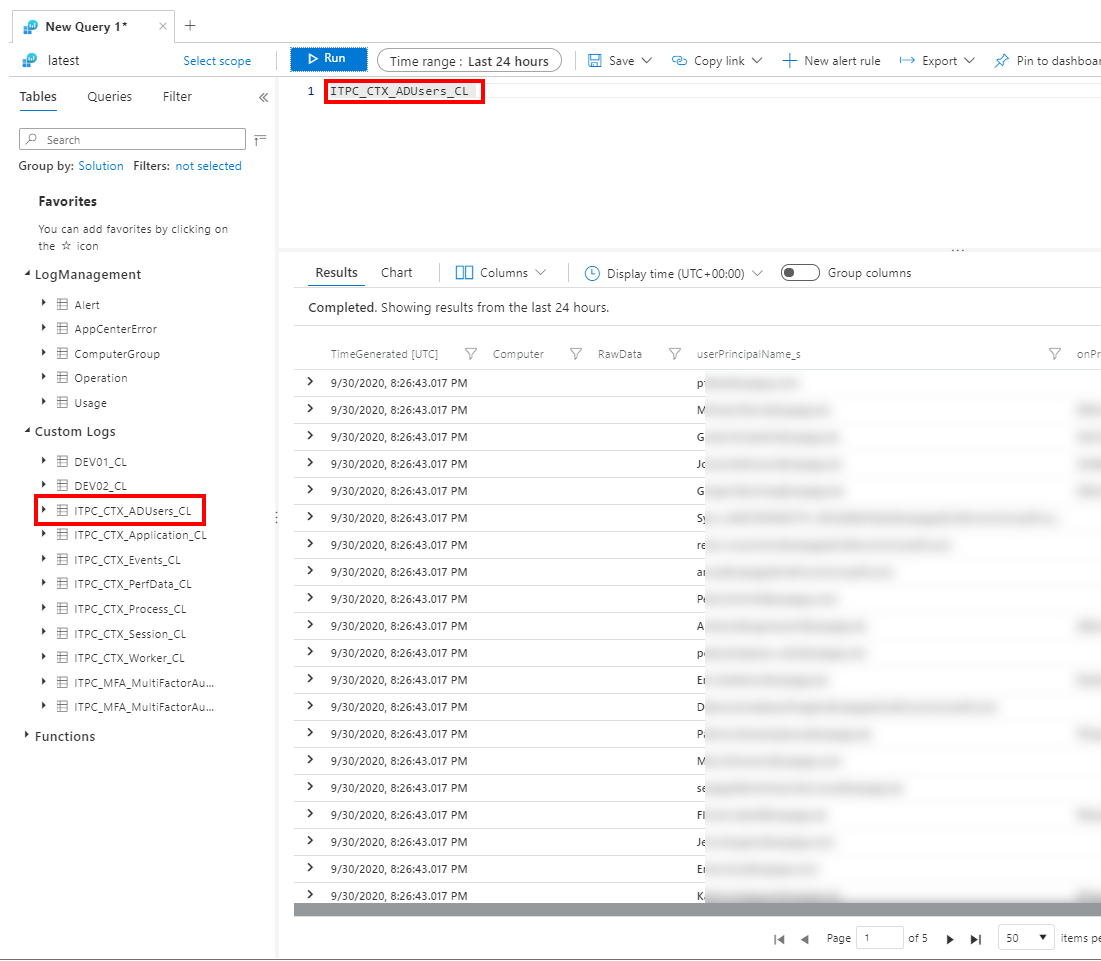
You can query the data from log analytics with "ITPC_CTX_ADUsers_CL". Keep in mind that it takes a while (30 minutes) to build the first upload schema.
Hint:
You can modify the filter and the properties you get back, modifying the query URL. The URL can be modified in "Initialize variable" in the logic app.
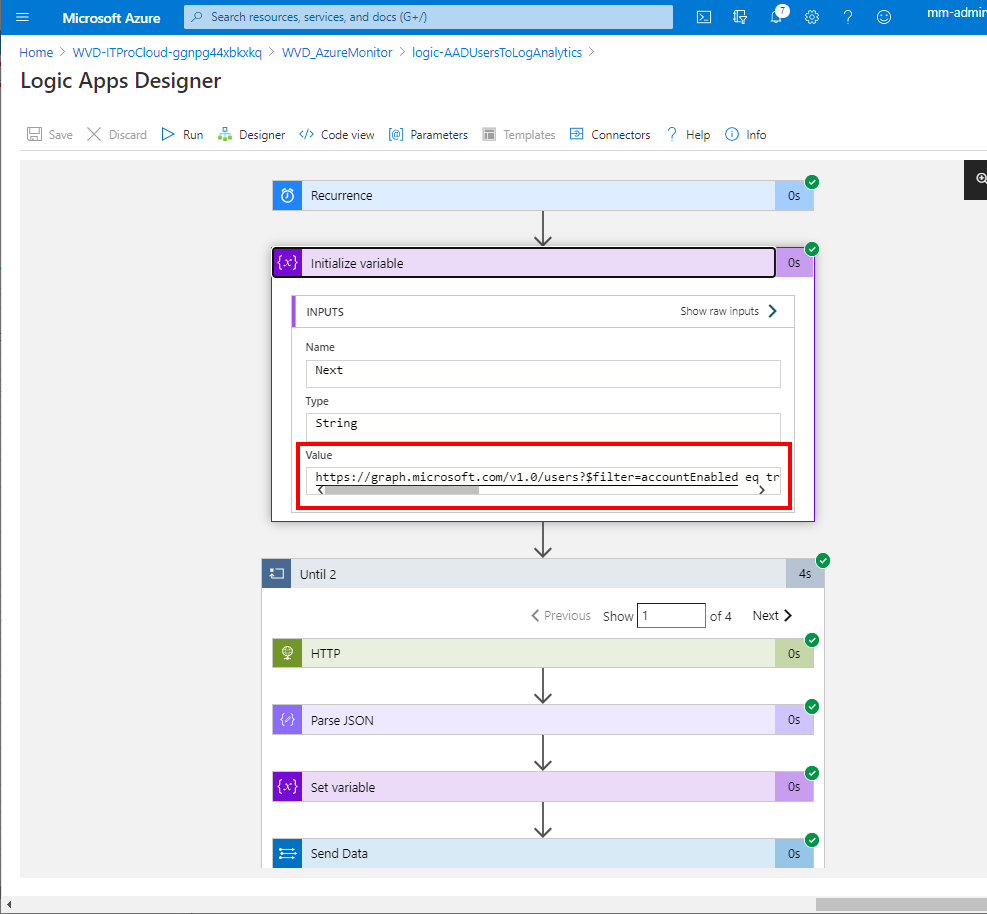
The default is:
https://graph.microsoft.com/v1.0/users?$filter=accountEnabled eq true and userType eq 'Member'&$select=userPrincipalName,onPremisesSamAccountName,employeeId,officeLocation,department
A list of valid properties is here: https://docs.microsoft.com/de-de/graph/api/resources/user?view=graph-rest-1.0